
This Slash Command Was Quietly Costing Me $800 a Day


Last month my agent costs crossed $800 in a single day, and on paper nothing about my work explained it. I was using the same models, on the same projects, and running the workloads I’d been running for weeks. I was tracking spend at the session level, and the per-session numbers all looked reasonable on their own, which is exactly the kind of thing that lets a problem hide in plain sight.
When I finally pulled the full session data and traced the curve, the culprit was a slash command I’d written myself - something I used every day and had no reason to suspect, because each individual call inside it looked cheap.
The cost was in the shape of the run, not the price of any one piece of it.
The workflow
The slash command sits at the end of my dev loop. I run /ship, which I prompted into existence with four words: “commit, push, pr, babysit”. From there the agent picks up the manual tail of the process I never enjoyed doing.
It watches the pipeline status, keeps an eye on the Slack triggers tied to the PR, and once the review bots start leaving comments, it works through them and addresses the ones that hold up.
On paper this is exactly the kind of work an agent should be doing. It’s repetitive, it’s interrupt-driven, and most of it is the kind of waiting that a person can technically do, but resents doing. The trap, as I eventually figured out, lives inside the word “watches.”
How the cost actually accumulates
An agent waiting for CI does not wait the way a person does. A person waiting for CI gets coffee. An agent waiting for CI polls, and that distinction is where the bill comes from.
Every poll is a tool call. Every tool call pulls its output, in my case from the gh CLI, back into the model’s context. The next poll then runs against a context that already contains the previous poll’s output. The one after that contains both outputs, and the transcript keeps growing on every iteration. Each loop ends up reading and reasoning over more material than the one before it.
If the pipeline passes on the first try, none of this matters. You get a handful of polls and the loop ends before the cost has a chance to build. If the pipeline fails, retries, and fails again, you’re suddenly in a loop where each iteration is more expensive than the last, because the context coming into it has been padded by everything the loop has already seen.
The pricing on each token hasn’t changed. You are just buying more and more of them per call as the loop drags on. In my sessions, a single watch loop could triple the total cost relative to what the same work would have run without one. The damage is in the integral, not the peak.
What the curves show
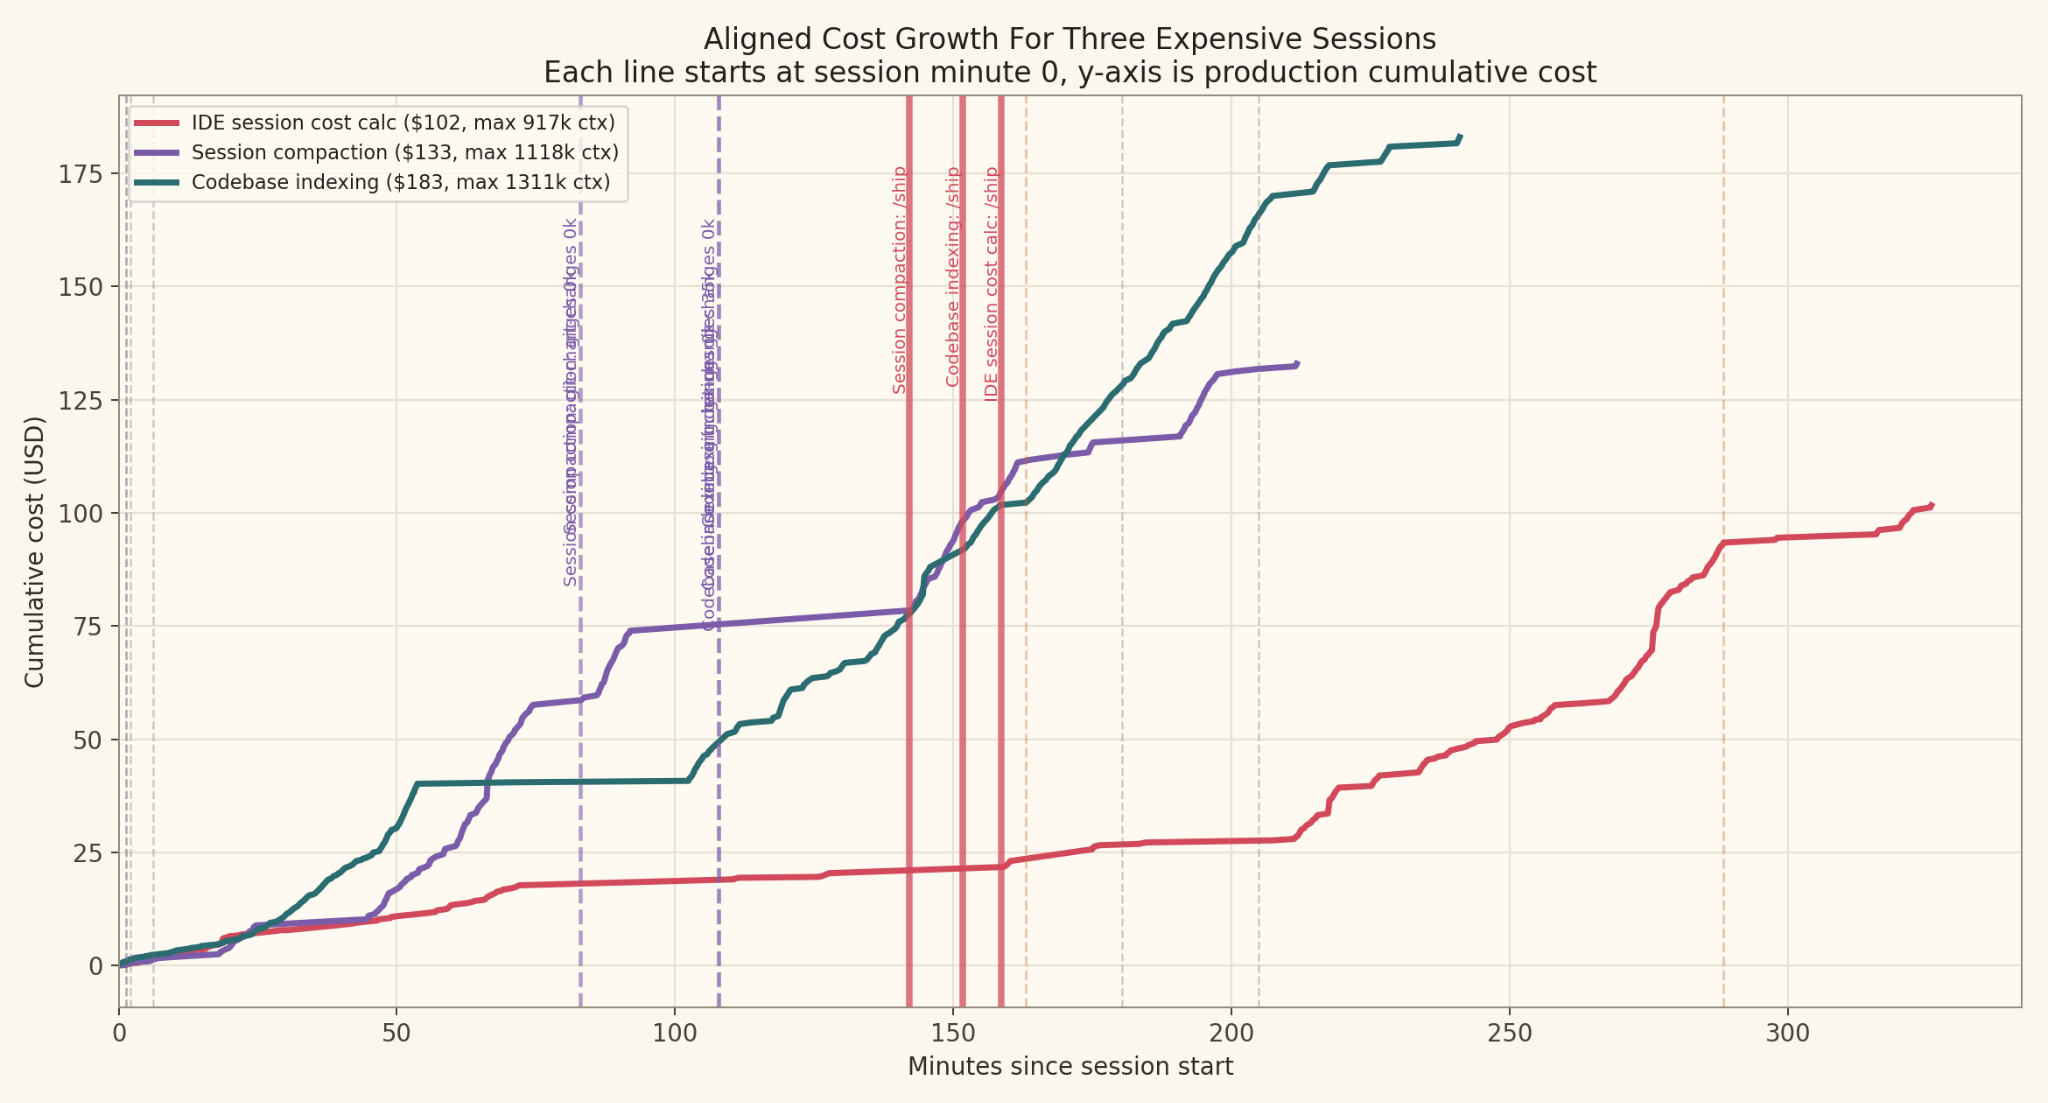
I pulled the three most expensive sessions I had on file:
Session A: $101.65 across 283 requests, peak context of 917k tokens
Session B: $132.96 across 274 requests, peak context of 1.1M tokens
Session C: $182.99 across 496 requests, peak context of 1.3M tokens
Session C is the one that made the pattern impossible to miss. /ship (my custom slash command) fired around the 151 minute mark, and from there the session was dominated by a long tail of CI and check log calls stretching across the next eighty minutes.
Each of those calls is the loop reading the pipeline status one more time. The cost curve climbs the whole way, not because the agent is making progress, but because it is paying full price to wait.
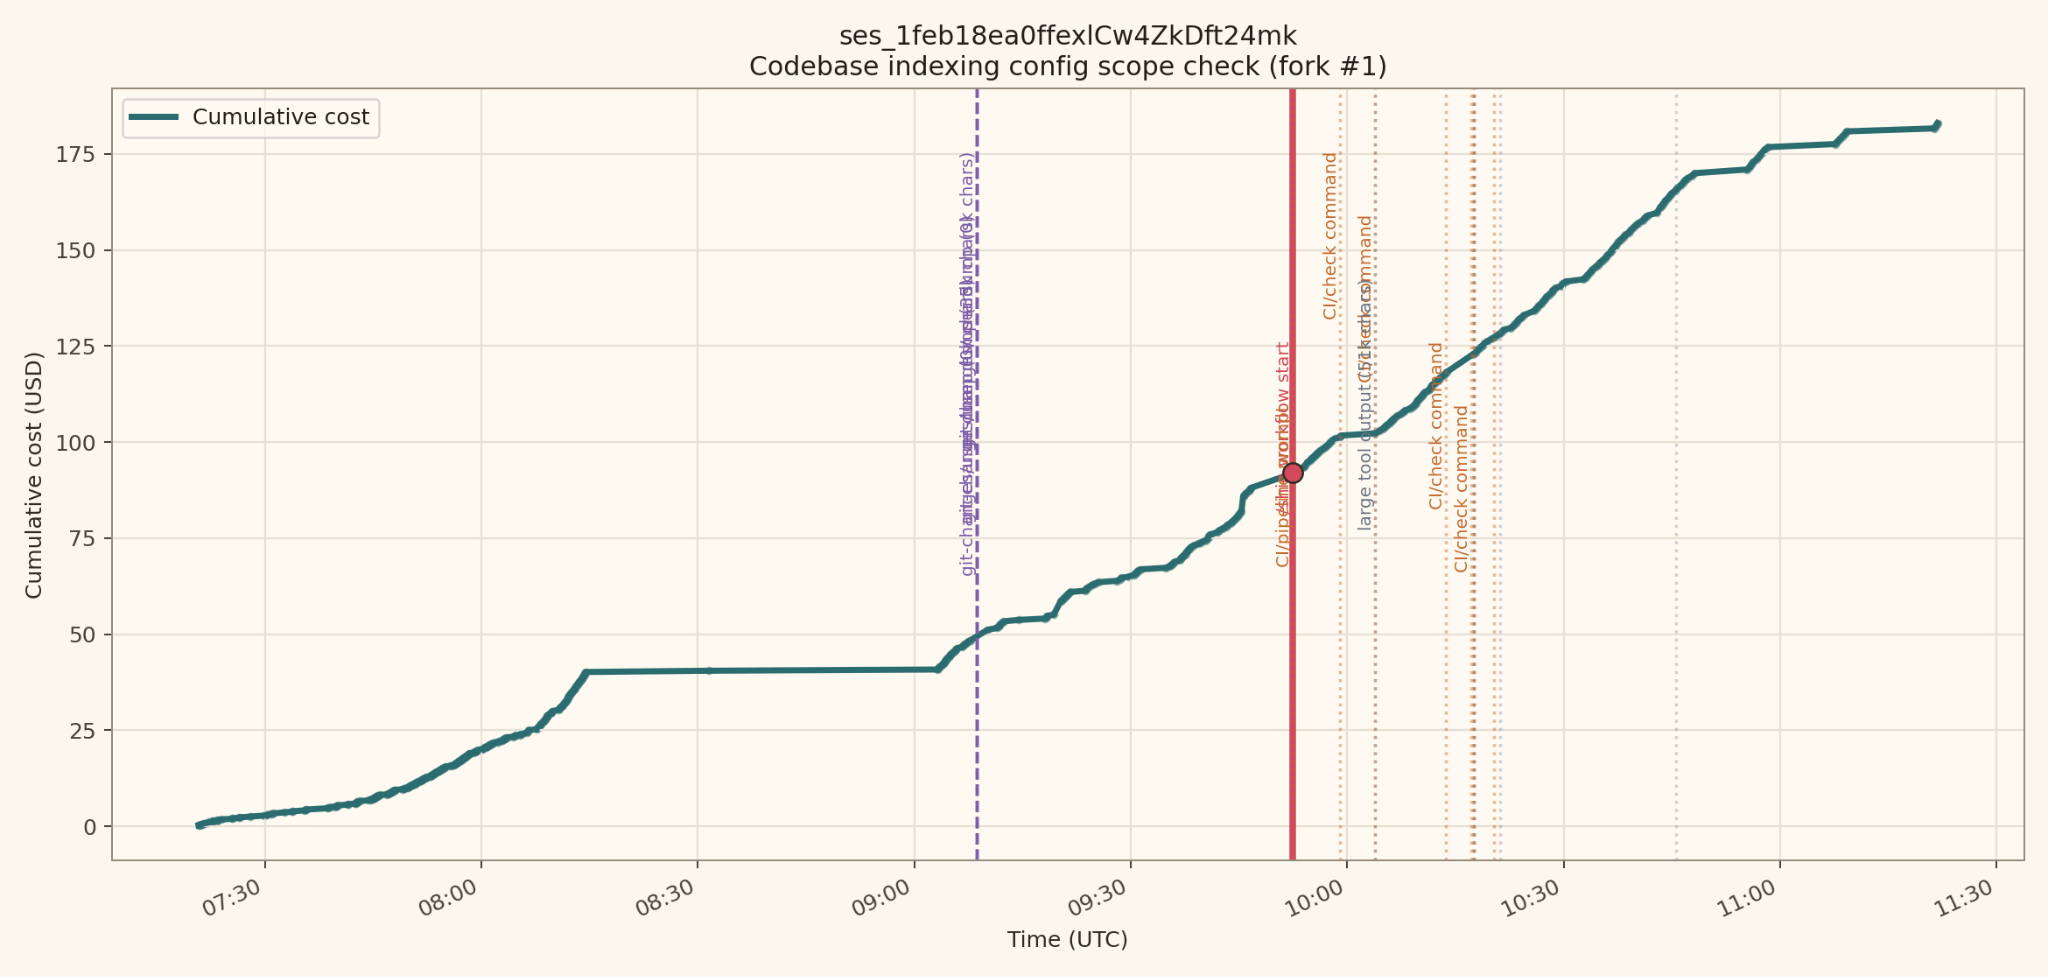
That 496 request count, sitting almost twice as high as the other two sessions, is almost entirely the loop. The other sessions were expensive for their own reasons, but neither of them produced the long, low-grade tail of status checks that look cheap individually and aren’t.
The worst case is Opus plus flaky tests
The curve gets uglier when two things line up.
The first is Claude Opus, which has a prompt cache window of roughly five minutes. Once your polls space out wider than that, or your retries land on intervals that straddle the boundary, the cache stops helping. Cache discounts are meaningful, and losing them on every call inside a long loop adds up faster than you’d expect.
The second is flaky tests. When tests fail and retry, the watch loop doesn’t just keep polling at the same pace. It re-reads more output, re-evaluates state, and then sits there waiting for the next attempt. Each retry restarts the cost arc on top of an even larger context.
What you get is a cost curve that climbs in steps rather than a smooth line. One step per retry, and the height of each step is set by how much transcript the loop has already accumulated by the time the retry hits - a compounding effect that can seriously drain your token budget.
What to look for in your own setup
I described this to another engineer on the team and he recognized it in his own slash commands inside of a minute. I think the pattern is broadly under-noticed because no single call inside the loop looks expensive on its own. You have to look at the full session curve to see what’s actually happening, and most people don’t do that until something has already gone wrong.
If you have any agent flow that watches something rather than does something, pull up the cost curve for a session where it ran. Look for a sudden slope change tied to a specific tool call. That’s almost always where the loop began.
It doesn’t matter whether you’re polling a CI pipeline, watching a queue, or monitoring a Slack channel for a response. The mechanics are the same. The fix is to stop letting agents wait in-context: use webhooks, longer poll intervals, or an inexpensive model to summarize state between checks. The context window does not care what you are waiting for.
 |
|
You have a beautiful solution in Kilo named "Webhooks" — wouldn't it be better to "delegate" watching phase to it e.g., instead of "active" waiting by reading and retrying on the loop, wait for the event (GitHub can send you everything or just the things you want) to trigger the analysis?