
Cloud Agents: The Missing Layer in Your DevOps Pipeline
5 Real Use Cases for DevOps and Platform Engineers

Platform and DevOps teams have spent years wiring together CI/CD, infrastructure-as-code, observability, and incident management. The detection and notification layers are solid. The gap is what happens next.
A drift detection tool flags a mismatch. An alert fires at 2am. A policy check fails on a PR. In each case, the system knows something needs attention, but the actual work still falls on an engineer doing repetitive, context-heavy tasks that don’t require much creative judgment.
Kilo’s Cloud Agents with Webhook Triggers close that gap. When an external system sends an HTTP request to your webhook URL, Kilo spins up a Cloud Agent session: an isolated Linux container that clones your repo, injects your environment variables, and starts executing based on a prompt template that references the incoming payload. The agent can read code, run commands, modify files, and auto-commit changes to a dedicated branch.
For platform teams, this means you can build internal automations where the response to an event isn’t just a notification. It’s an agent that does the work.
Here are five workflows where this changes the game for DevOps and platform engineers.
1. Incident Response: Context Before the Engineer Is Fully Awake
On-call rotations are stressful enough without spending the first 20 minutes of an incident gathering context. The agent can do that legwork before the engineer even opens their laptop.
Hook into your alerting system and trigger a Cloud Agent when a P1 fires. The gh CLI comes preinstalled, so the agent can query GitHub history directly:
A P1 incident has been triggered:

{{bodyJson}}

Analyze the codebase for this incident (read-only, no changes):
1. Identify code paths related to the affected service/endpoints
2. Use `gh` to check recent PRs merged to this service (last 48 hours)
3. Review git log for recent commits to affected files
4. Look for error handling patterns that might explain the symptoms
5. Search for TODOs or FIXMEs in affected areas

Document findings in `incident-triage.md`:
- Relevant file paths and code sections
- Recent commits and PRs that touched those files
- Potential root causes ranked by likelihood
- Suggested areas to investigate

Do NOT make any code changes. This is analysis only.
By the time the on-call engineer is looking at the incident, there’s a triage document with recent deploys, relevant code changes, and potential root causes already compiled. That’s 15-20 minutes of context-gathering they skip entirely.
2. Security Vulnerability Response
When a CVE drops for a dependency you’re using, the clock starts ticking. The response pattern is almost always the same: identify affected services, bump the version, check for breaking changes, run tests, open a PR. It’s urgent, well-scoped, and repetitive. A perfect fit for automation.
Integrate with your security scanning pipeline (such as Dependabot) and fire a webhook when a vulnerability is detected:
A security vulnerability has been detected:

{{bodyJson}}

Respond to this vulnerability:
1. Update the affected package to the patched version specified
2. Run the test suite to check for regressions
3. If tests fail, check the package changelog for breaking changes and
   update code accordingly
4. Check for other usages of vulnerable patterns mentioned in the advisory

Commit: "security: patch {{body.vulnerability.id}} in [package]"

If the update cannot be completed automatically, create
`security-remediation-notes.md` explaining what manual steps are needed.
For regulated industries where you need to demonstrate rapid response to security issues, this also creates an audit trail of automated remediation attempts. The agent handles the mechanical patching; your team reviews the results and handles the edge cases.
Note on test suites: Each Cloud Agent message can run for up to 15 minutes. If your full suite is longer, have the agent run a targeted subset and leave the comprehensive run for CI on the resulting PR.
3. Policy Enforcement That Fixes Instead of Blocks
Most policy enforcement in CI is a gate: a PR fails a check, the developer gets a cryptic error, and they spend 20 minutes figuring out what the policy actually requires. For application developers who don’t work in infrastructure code daily, this is a constant source of friction. And for platform teams, it means a steady stream of “can you help me fix this policy violation” messages.
Flip the model. When a policy check fails, trigger a webhook with the violation details:
A policy violation has been detected in a pull request:

{{bodyJson}}

Fix the policy violation:
1. Read the policy definition to understand the requirement
2. Review the violating resource/configuration
3. Make the minimum change needed for compliance
4. Verify the fix doesn't break existing functionality
5. Add a code comment explaining the policy requirement for future reference
6. Commit: "fix(policy): resolve [policy-name] violation in [file]"

If the fix requires a design decision (multiple valid approaches),
document options in `policy-fix-options.md` instead of choosing arbitrarily.
Instead of blocking a developer’s PR with a wall of errors, the agent pushes a commit that fixes the violations. The developer sees what changed and learns the policy through the fix itself. Your platform team stops being the “PR rejection department.”
4. Dependency and Base Image Upgrades Across the Fleet
When the platform team ships a new base image, updates a shared library, or deprecates an internal API, rolling that change across dozens of services is brutal. You can automate the version bump, but the integration work (updated imports, changed APIs, new config) requires understanding each service’s codebase.
Trigger a webhook for each affected repo when a platform update ships:
A platform dependency update is available:

{{bodyJson}}

Update this service to the new platform dependency:
1. Update the dependency version in the appropriate manifest
2. Read the migration guide at the URL provided in the payload
3. Apply required code changes based on the migration guide
4. Run the test suite
5. If tests fail, review errors against the migration guide and apply fixes
6. Commit: "chore(platform): upgrade [dependency] to [version]"

If migration cannot be completed automatically, create `migration-notes.md`
documenting what was done and what remains.
The agent doesn’t just bump a version number. It reads the migration guide, applies changes specific to each service’s usage patterns, and runs tests. Most PRs come back ready to merge. The ones that don’t include notes explaining what needs human attention.
5. Post-Merge Documentation Sync
Documentation drift is inevitable. Code changes, docs don’t, and suddenly your README is lying about how your API works. For platform teams maintaining internal developer docs, this compounds fast across many services.
Wire up a webhook to fire on merged PRs. The payload contains the diff, commit messages, and PR description. The agent can scan for changes that affect documentation and keep things in sync:
A pull request has been merged:

{{bodyJson}}

Check if this PR requires documentation updates:
1. Analyze the diff for changes to public APIs, CLI flags, config options,
   or environment variables
2. If documentation-relevant changes are found:
   - Update corresponding docs files (README, API docs, config references)
   - Ensure code examples still reflect the current implementation
   - Update any version references or changelog entries
3. If no documentation impact is detected, note that in a commit message
   and exit

Commit: "docs: sync documentation with [PR number]"
This pairs well with Kilo’s Code Reviews feature: your AI reviewer catches code issues before merge, and your webhook-triggered agent keeps docs in sync after.
How to Set This Up
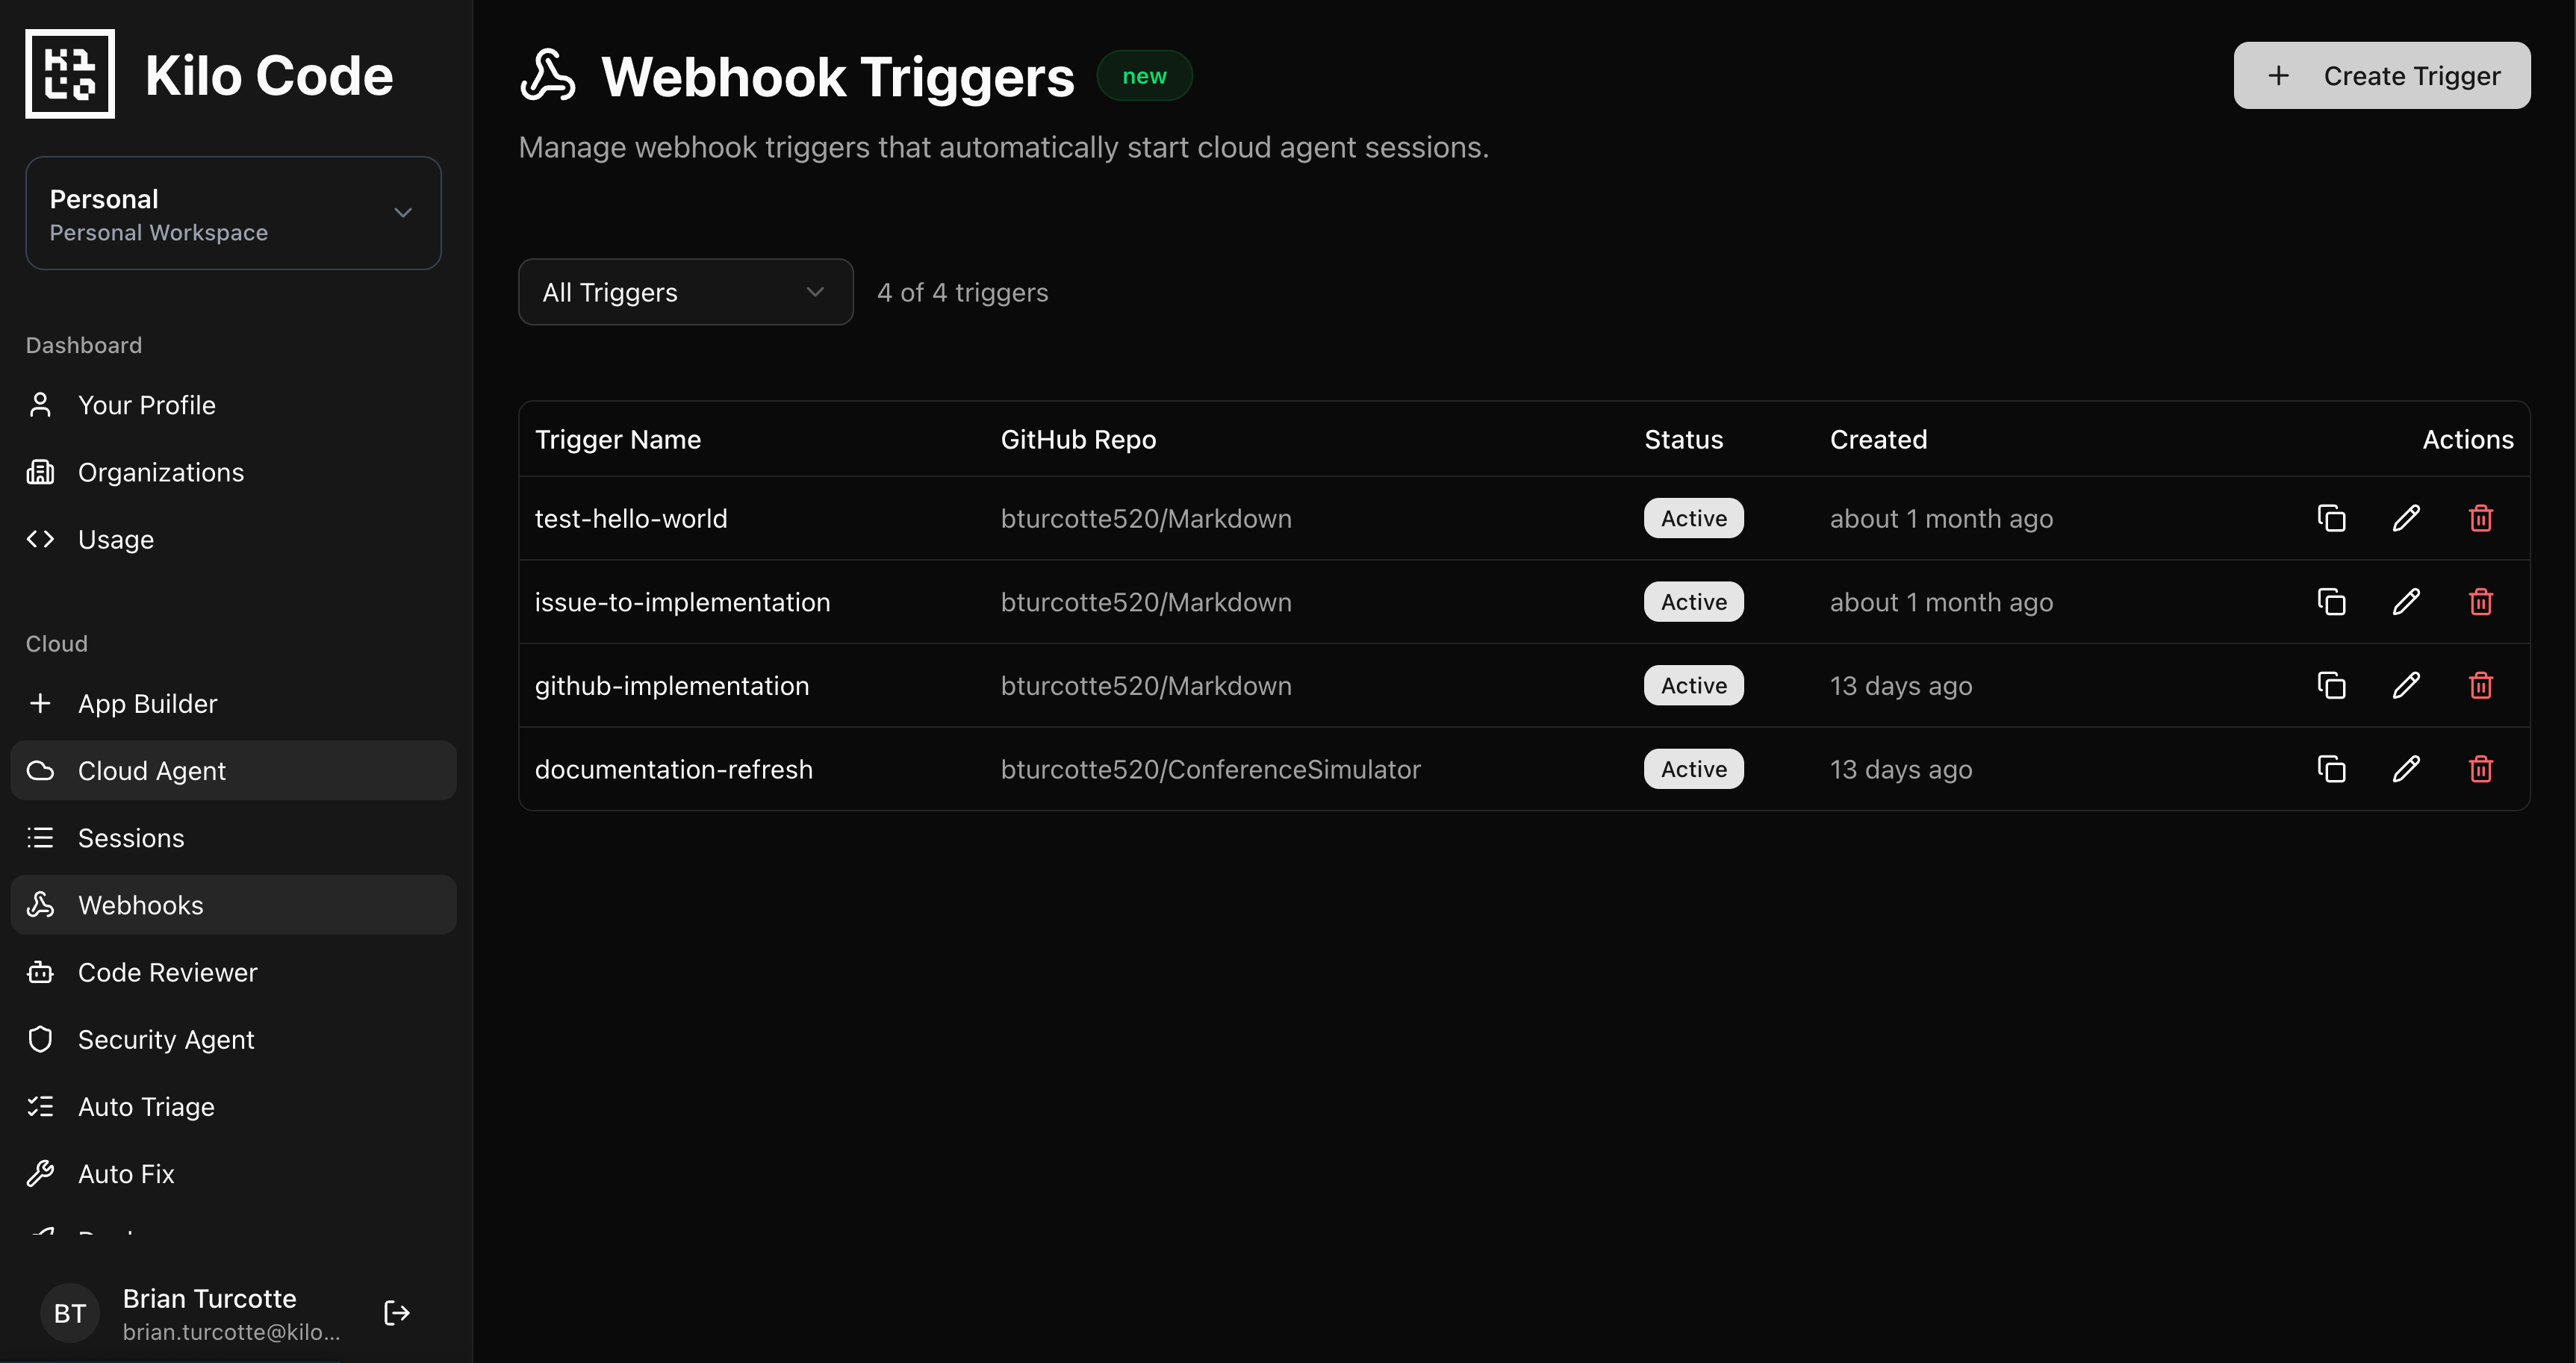
All webhook configuration lives in the Kilo Dashboard at app.kilo.ai/cloud/webhooks:
Create an Agent Environment Profile with the env vars, secrets, and startup commands your automations need. Install any tools not in the base image via startup commands here. Profiles are reusable across multiple triggers.
Configure a Webhook Trigger with your prompt template and target repo. The trigger resolves the profile at runtime, so profile updates automatically apply to future executions.
Copy the webhook URL and wire it into your existing systems: GitHub Actions, PagerDuty, Slack workflows, internal portals, cron jobs.
For personal accounts, webhook sessions run in the same container as your Cloud Agent sessions. You can watch them execute in real time. For organization accounts, webhooks run in dedicated compute as a bot user. Completed sessions can be shared with or forked by anyone on the team, giving full visibility into what the agent did.
Security
Webhook payloads can be susceptible to prompt injection if they contain untrusted input. For platform engineering use cases, this is a natural fit: you’re wiring together your own internal systems (alerting platforms, security scanners, CI pipelines). These are trusted sources.
Don’t expose webhook URLs to arbitrary external input. Use them as connective tissue between the internal systems you already operate.
What This Adds Up To
Platform teams have built the detection and notification layers. Webhooks add the response layer: an agent that handles the repetitive, context-heavy work sitting between “something happened” and “someone started working on it.”
Combined with Code Reviews for automated PR feedback, Deploy for one-click shipping, and Sessions that sync across every interface, webhooks let you build an internal developer platform where the routine work runs itself and engineers focus on the parts that actually need their judgment.
Glad the security issue was addressed. The cybersecurity industry is going nuts over the OpenClaw fiasco.